





Software’s Transition
to Agentic Enterprise AI
Measuring AI Impact Across the Vista Portfolio
The enterprise AI transition is moving from thesis to measurement. At Vista, we measure AI impact across two dimensions of value creation: revenue growth and margin expansion.

Co-Head of Flagship Fund
Two Dimensions of Value Creation Across the Portfolio
AI Costs and Efficiency
We believe AI monetization evidence is clear, though metrics aren’t standardized industry-wide.

AI Product Innovation
Nexthink’s AI-native products are focused on digital employee experience, where the company already sits close to the workflows, data, and operational signals that IT teams use. Spark, its autonomous IT-support agent, has demonstrated an approximately 80% resolution rate on IT tickets, and roughly 85% of customers are using one of Nexthink’s AI products. Those adoption levels are showing up in the commercial trajectory: AI ARR increased from $20 million in Q1 2025 to $109 million in Q1 2026, and the company projects it will exceed $200 million by early 2027 and represent more than half of revenue within two years.
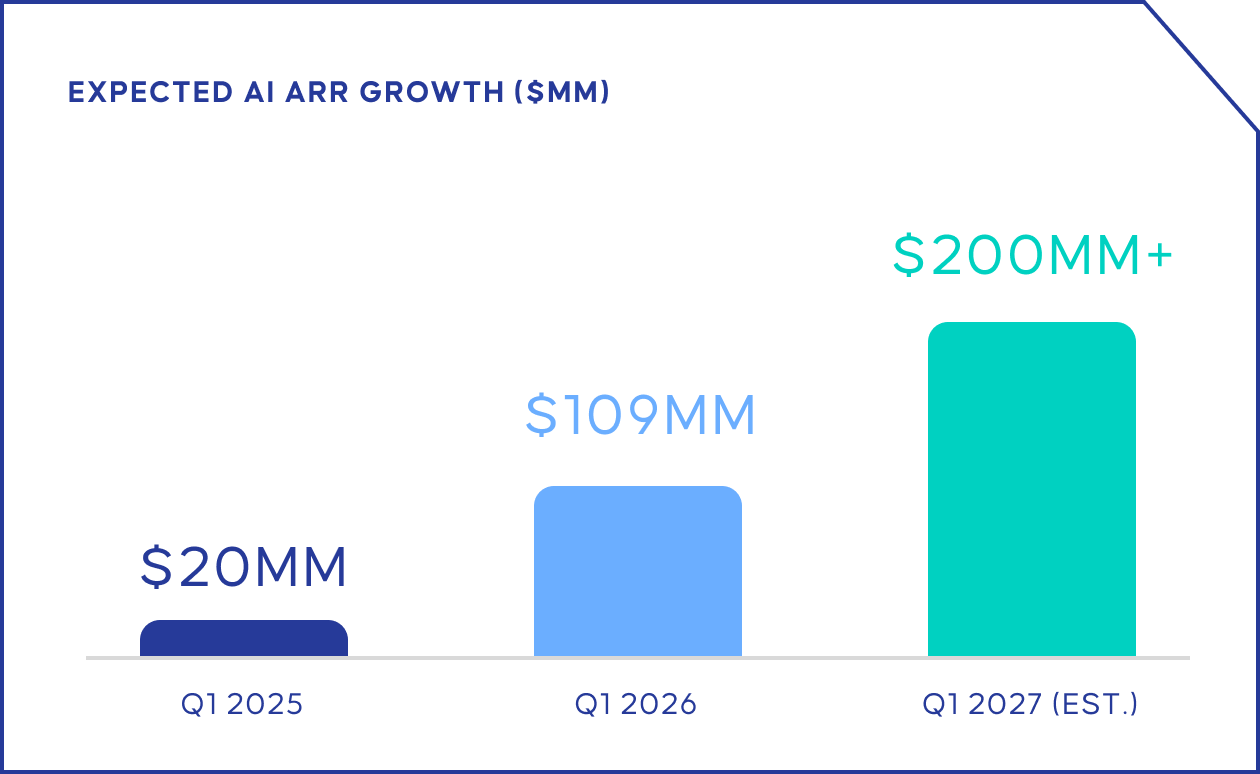
AI ARR growth increases from $20 million in Q1 2025 to $109 million in Q1 2026 and an estimated $200 million-plus in Q1 2027.
That revenue acceleration would likely be treated as strong evidence of AI-native traction from a younger company; here, it is appearing inside an incumbent software platform with existing customer relationships.

Pricing Transformation
We believe Sonatype illustrates the pricing opportunity most clearly. The company helps enterprises secure the open-source and third-party software components they use to build applications. Its prior per-developer model was becoming less aligned with value because developer-seat growth was flat while scan volume was increasing. Sonatype moved toward a pricing model that charges per scan that better reflects how customers use the product and how it delivers value. Over a 12-month period, licenses were down 1% while scans were up 40%, showing the old model was no longer capturing the activity flowing through the platform. The per-scan model is expected to contribute more than $10 million of incremental ARR, with migrated customers showing a 40% ARR increase, 80% longer contracts, and no change in renewal or win rates.

AI Products Operating Inside Workflows, Data Environments and Control Layers
LogicMonitor’s Edwin AI is an agentic solution that helps customers identify, prioritize and resolve IT incidents, completing operational tasks on behalf of users rather than only surfacing information for them to interpret. That agentic workflow is tied to measurable outcomes: a 60%+ reduction in response time, an approximately 25% reduction in incident volume, 85% reduction in alert noise, and more than two hours saved per incident. Those gains have translated into approximately $2 million in average annual customer savings, with ROI estimated at roughly 6x the average selling price.
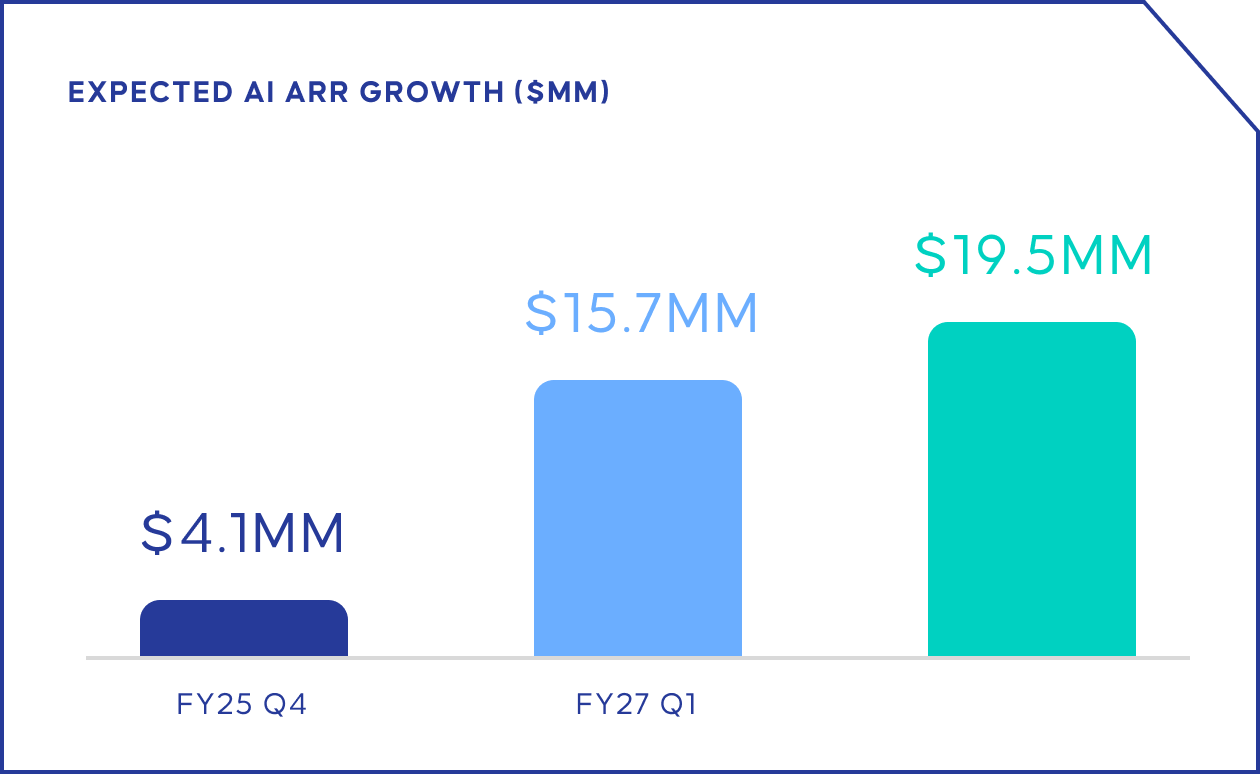
AI ARR grows from $4.1 million in FY25 Q4 to $15.7 million in FY27 Q1, with an additional $3.8 million committed by NTT for a total of $19.5 million.
Edwin AI’s realized ARR is expected to grow from $4.1 million in FY25 Q4 to $15.7 million in FY27 Q1, nearly 4x over five quarters — with committed consumption bringing contracted ARR to $19.5 million.
1) Source: Vista portfolio company data; Nexthink as of March 2026. Past performance is not necessarily indicative of future results, and there can be no assurance that historical trends will continue. Please refer to the Important Disclosures for additional information on topics discussed herein. Any estimated and/or forecasted metrics are based on assumptions Vista believes are reasonable. Such estimates and/or forecasts are subject to a number of important risks, qualifications, limitations and exceptions. There is no assurance that such metrics will be achieved. More information on key assumptions and limitations of these estimates is available upon request. Projected AI-Native ARR of $200MM+ as of Q1 2027 reflects management’s internal estimates and is subject to change based on actual business performance, market conditions, and other factors. Projected AI-Native ARR is calculated as the sum of two components: (i) anticipated expansion of ARR attributable to the company’s existing AI product portfolio, driven by continued adoption and deepening utilization among customers currently engaged with AI-native capabilities, including Nexthink Assist and AI Drive, and (ii) anticipated incremental ARR contributions from Nexthink Spark, the company’s autonomous IT support agent, based on management’s assumptions regarding customer adoption rates, pricing, and endpoint penetration over the forecast period.
2) Source: License and scan data as of May 2025, all other data as of April 2026. Expected incremental ARR of $10MM+ reflects management’s internal estimates of incremental revenue attributed to pricing model changes and is subject to change based on actual business performance, market conditions, and other factors. Past performance is not necessarily indicative of future results, and there can be no assurance that historical trends will continue. Please refer to the Important Disclosures for additional information on topics discussed herein. Any estimated and/or forecasted metrics are based on assumptions Vista believes are reasonable. Such estimates and/or forecasts are subject to a number of important risks, qualifications, limitations and exceptions. There is no assurance that such metrics will be achieved. More information on key assumptions and limitations of these estimates is available upon request.
3) Source: Vista portfolio company data; LogicMonitor as of May 2026. Past performance is not necessarily indicative of future results, and there can be no assurance that historical trends will continue. Please refer to the Important Disclosures for additional information on topics discussed herein. Any estimated and/or forecasted metrics are based on assumptions Vista believes are reasonable. Such estimates and/or forecasts are subject to a number of important risks, qualifications, limitations and exceptions. There is no assurance that such metrics will be achieved. More information on key assumptions and limitations of these estimates is available upon request.
Efficiencies from AI within operations can directly translate into operating leverage.
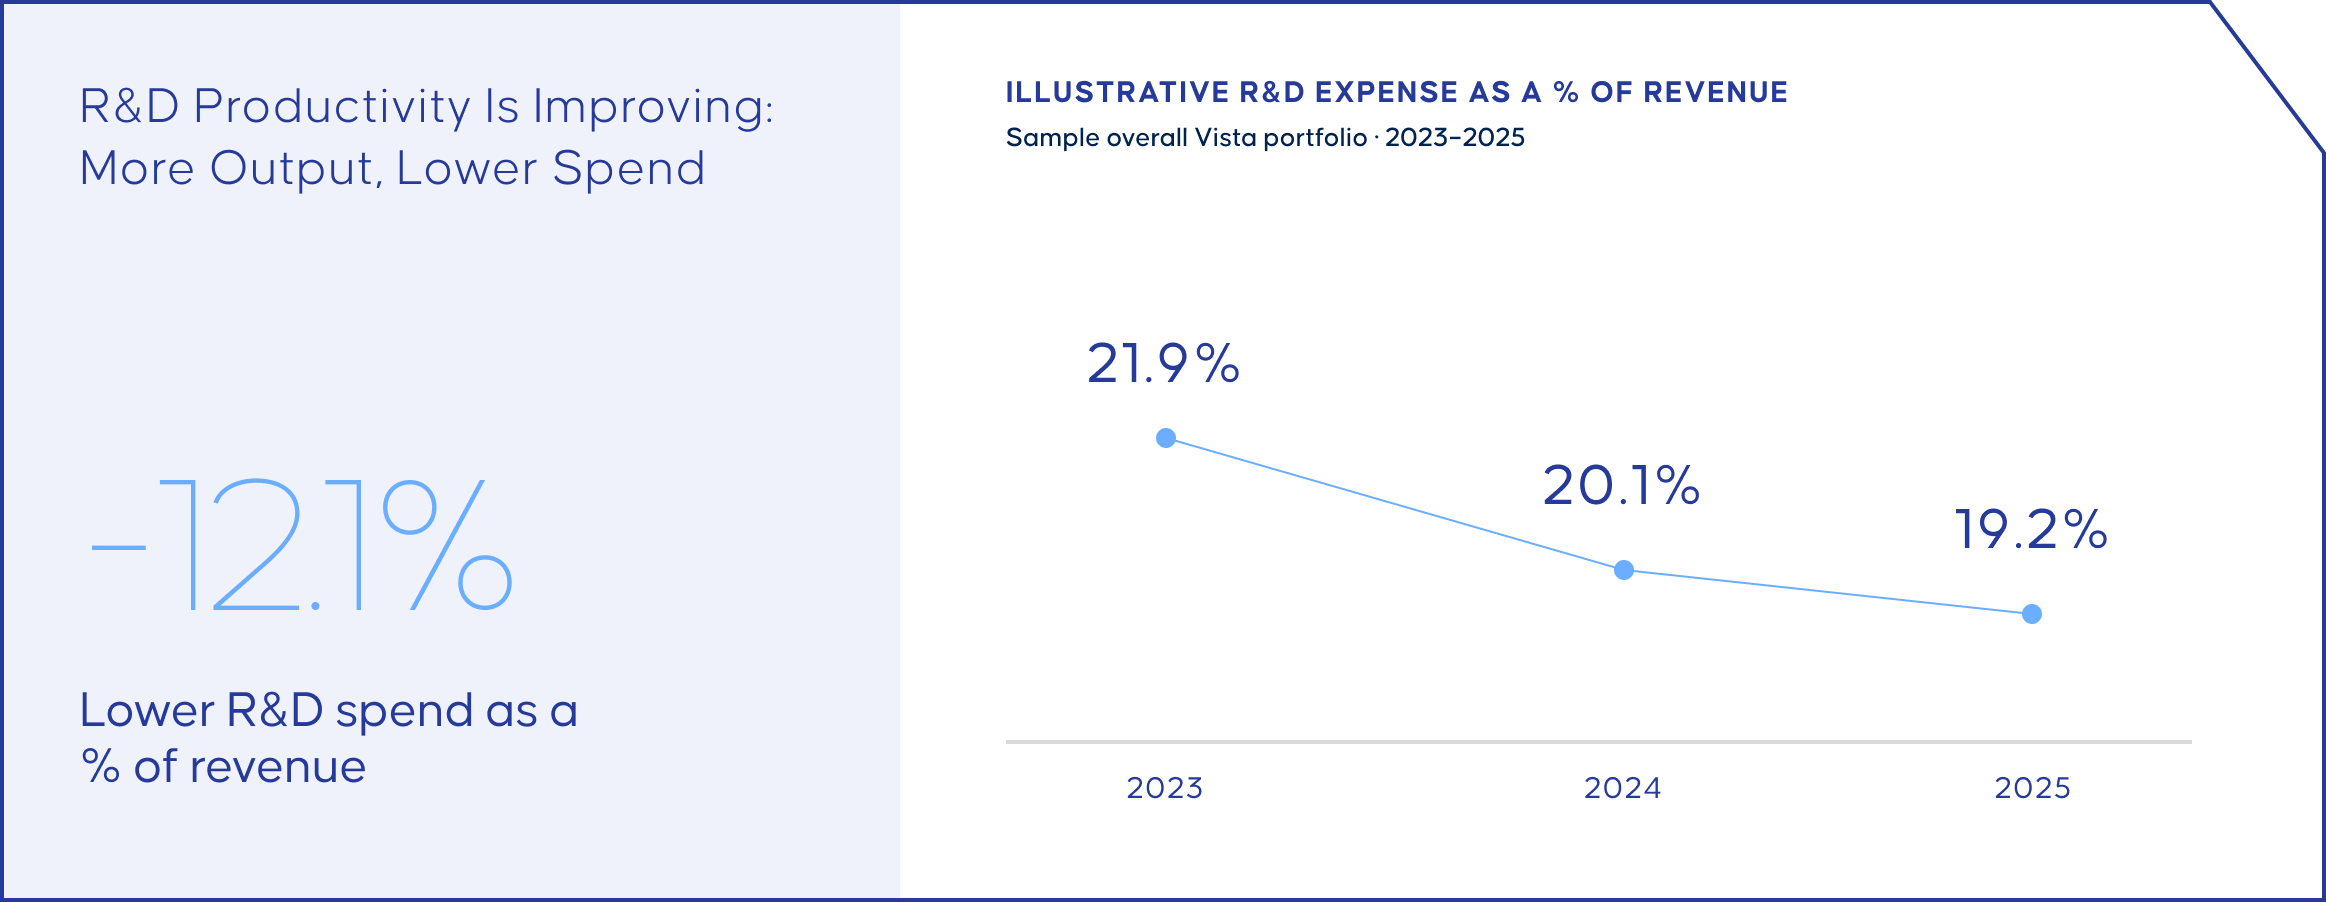
R&D Productivity is Improving: More Output, Lower Spend down 12.1% lower R&D Spend as a % of revenue. Illustrative R&D expense as a percentage of revenue decreases from 21.9% in 2023 to 20.1% in 2024 and 19.2% in 2025, a 12.1% reduction.
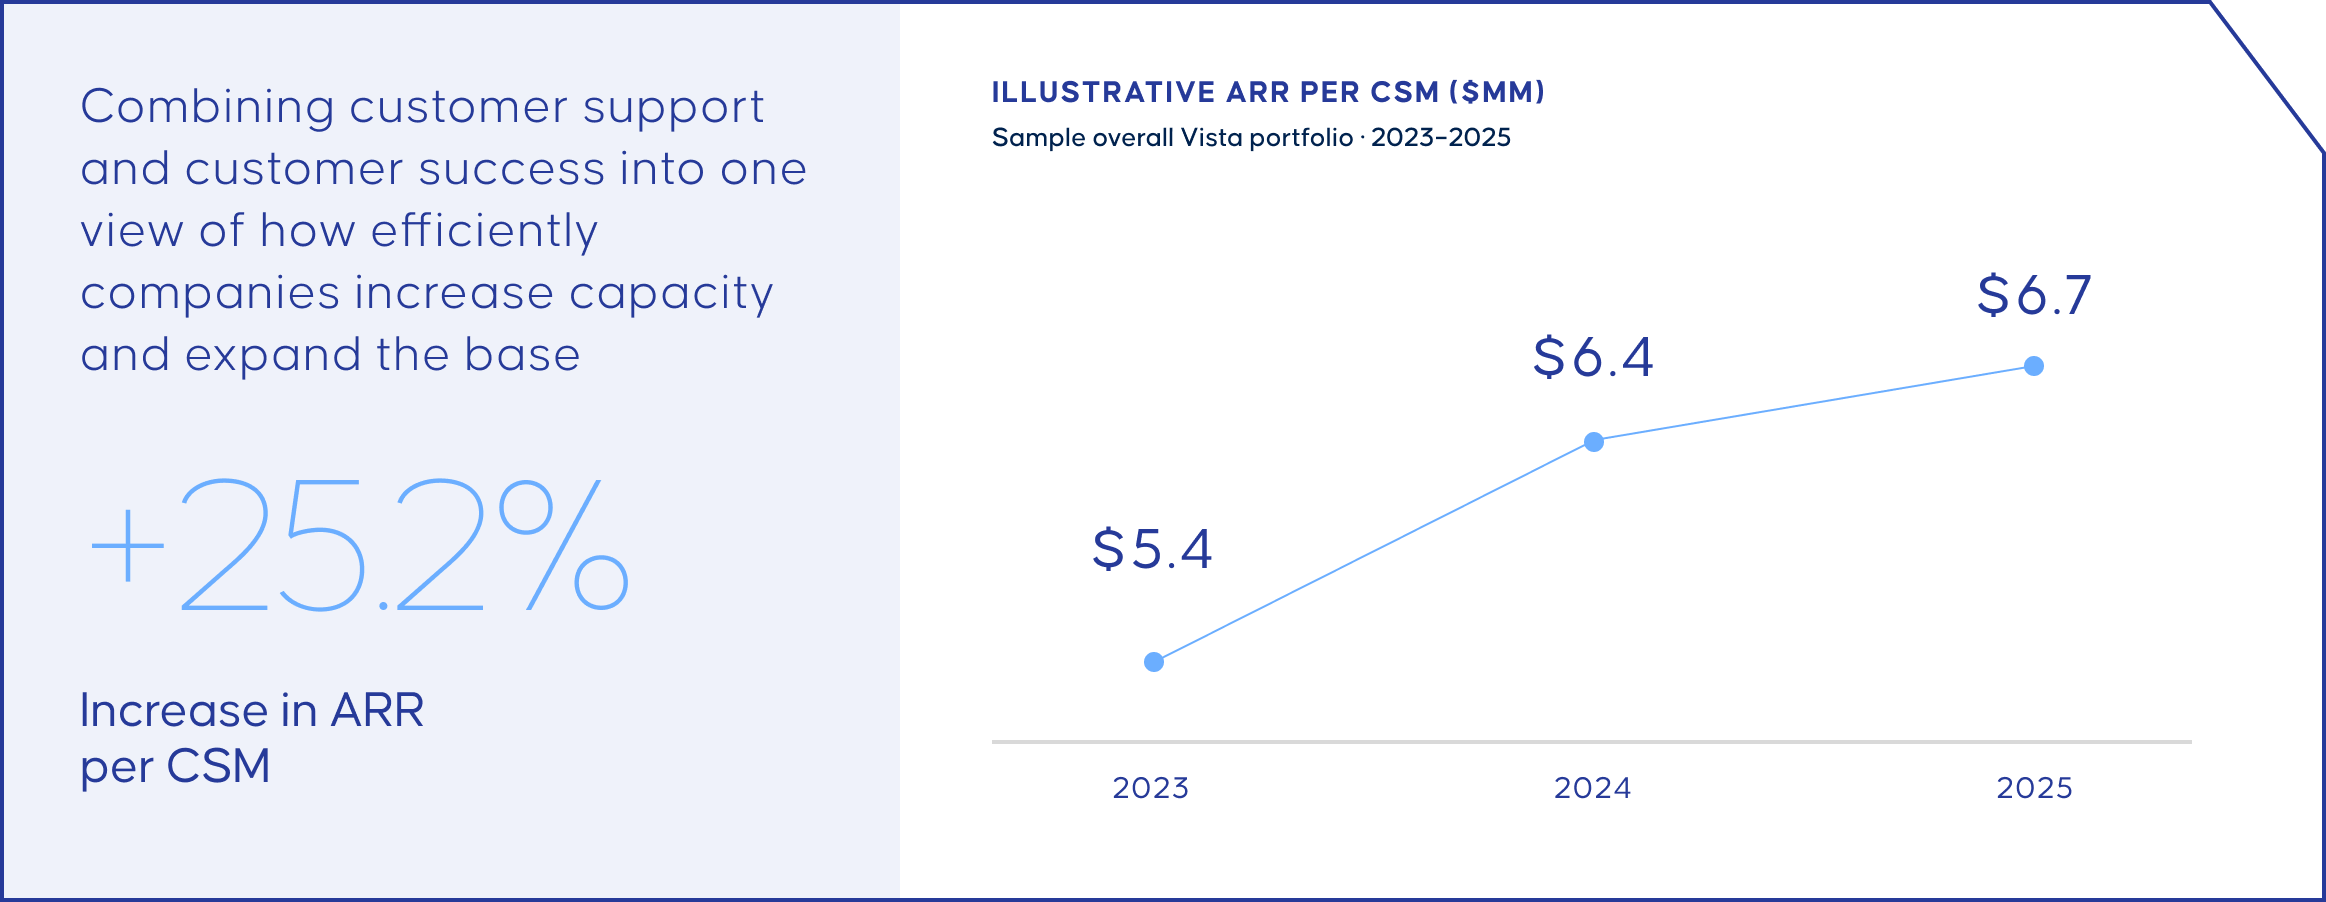
ARR per customer success manager increases from $5.4 million in 2023 to $6.4 million in 2024 and $6.7 million in 2025, a 25.2% increase.
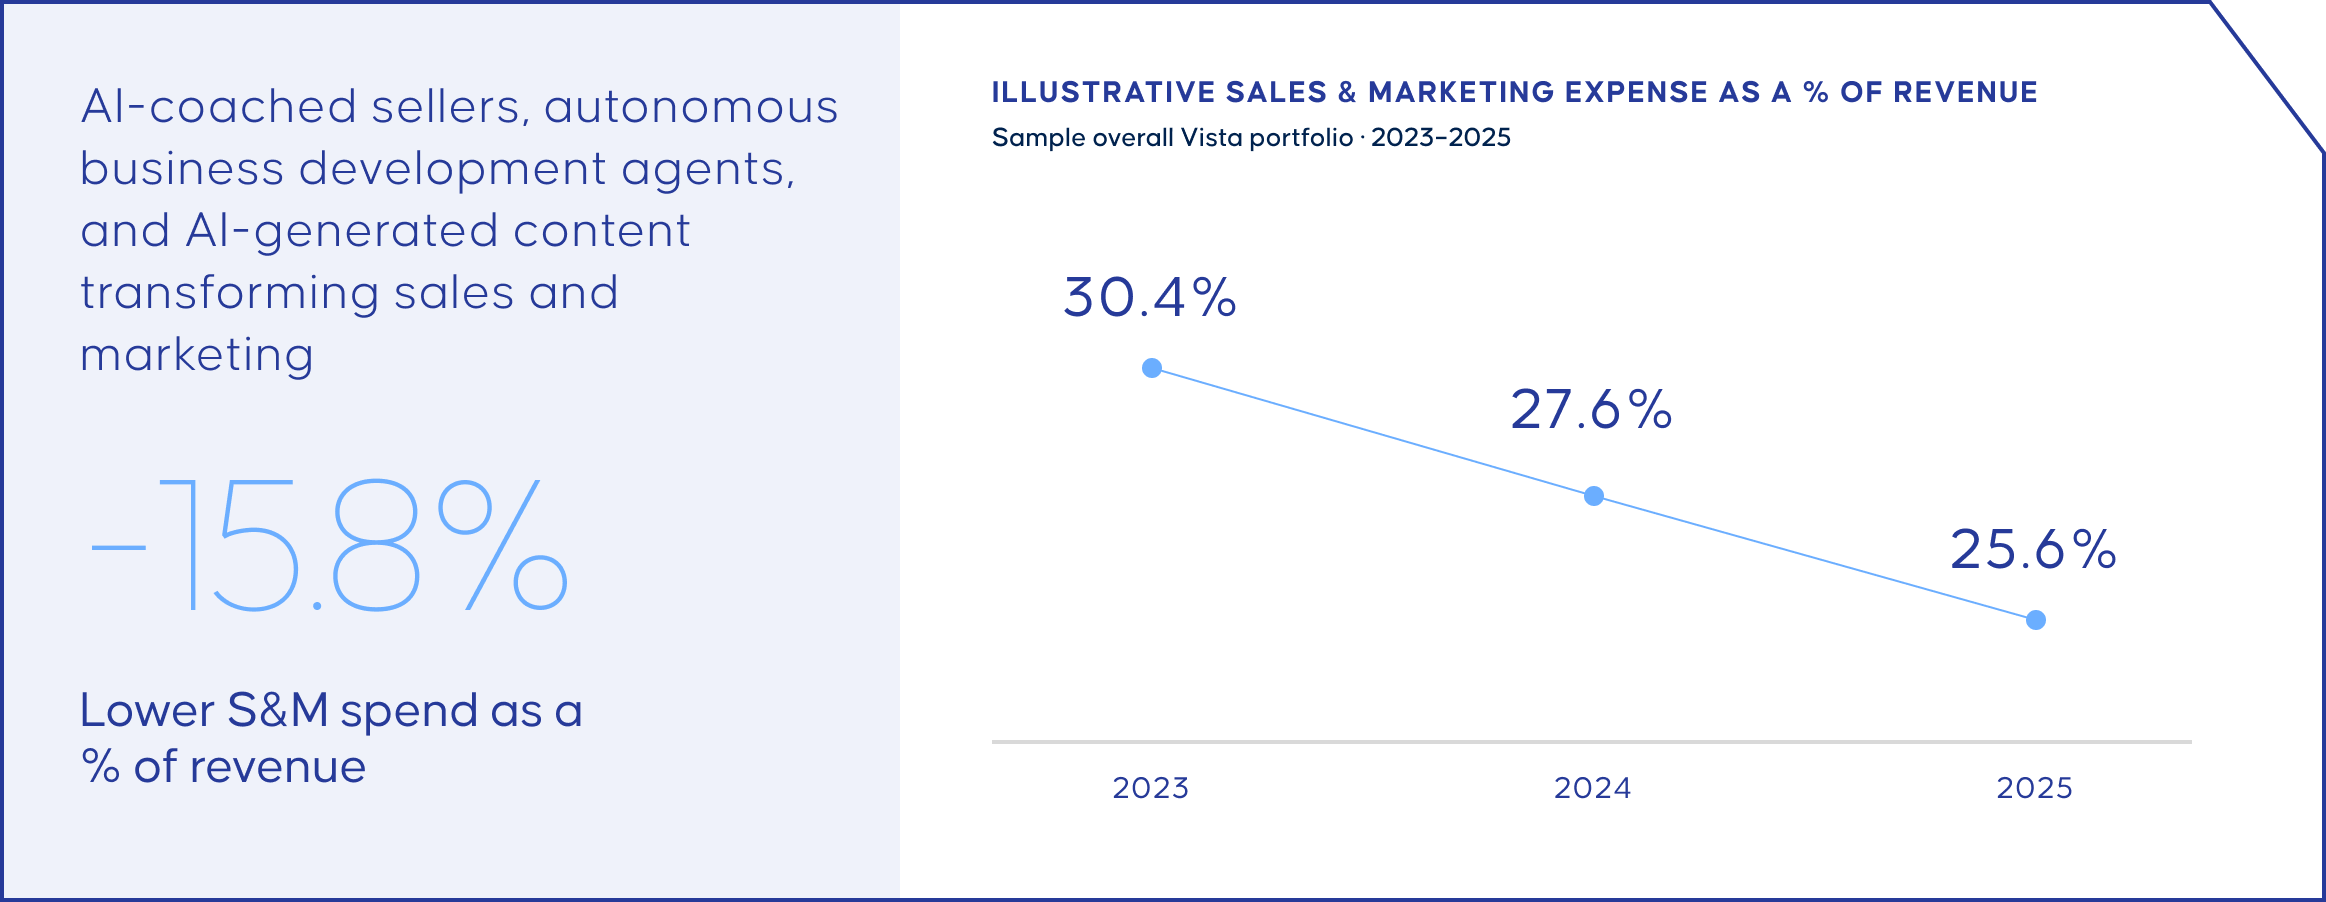
Sales and marketing expense as a percentage of revenue decreases from 30.4% in 2023 to 27.6% in 2024 and 25.6% in 2025, a 15.8% reduction.
1) Past performance is not necessarily indicative of future results, and there can be no assurance that historical trends will continue. The information presented herein are based upon Vista’s analysis and assumptions and reflect Vista’s beliefs. There can be no assurances that any plans, estimates or expectations noted herein will occur as described, if at all. Source: Vista analysis as of 12/21/2025. Analysis based on portfolio company reporting to Vista. Portfolio companies are encouraged but not obligated to respond, As such, this list is not comprehensive. (1) Research and Development (“R&D”) FTEs per $10MM of Revenue includes 30 portfolio companies (Flagship / Perennial = 15, Foundation = 8, Endeavor = 7). (2) R&D Expense as % of Revenue includes 54 portfolio companies (Flagship / Perennial = 28, Foundation = 17, Endeavor = 9).
2) Past performance is not necessarily indicative of future results, and there can be no assurance that historical trends will continue. The information presented herein are based upon Vista’s analysis and assumptions and reflect Vista’s beliefs. There can be no assurances that any plans, estimates or expectations noted herein will occur as described, if at all. Source: Vista analysis as of 12/31/2025. Analysis based on portfolio company reporting to Vista. Portfolio companies are encouraged but not obligated to respond. As such, this list is not comprehensive. (1) Annualized Recurring Revenue (“ARR”) per Customer Success Manager (“CSM”) is defined as the total beginning-of-period ARR managed by CSMs divided by the number of CSMs responsible for that revenue. ARR per CSM includes 17 portfolio companies (Flagship / Perennial = 8, Foundation = 4, Endeavor = 5). (2) CSM Expense as % of Revenue includes 26 portfolio companies (Flagship / Perennial = 14, Foundation = 6, Endeavor = 6).
3) Past performance is not necessarily indicative of future results, and there can be no assurance that historical trends will continue. The information presented herein are based upon Vista’s analysis and assumptions and reflect Vista’s beliefs. There can be no assurances that any plans, estimates or expectations noted herein will occur as described, if at all. Source: Vista analysis as of 12/31/2025. Analysis based on portfolio company reporting to Vista. Portfolio companies are encouraged but not obligated to respond. As such, this list is not comprehensive. (1) Sales and Marketing (“S&M”) FTEs per $10MM of Revenue includes 29 portfolio companies (Flagship / Perennial = 15, Foundation = 7, Endeavor = 7). (2) S&M Expense as % of Revenue includes 55 portfolio companies (Flagship / Perennial = 28, Foundation = 18, Endeavor = 9).